← All workRiskFloor · UX research · 2026 · Case study 5 of 5
Giving free-tool regulars a reason to sign up
Research in progress · November 2026Finding the visitors who keep coming back to a free currency strength meter but never create an account, then building proto-personas, a research plan and three sketched directions around them, without putting the tool behind a wall.
Context
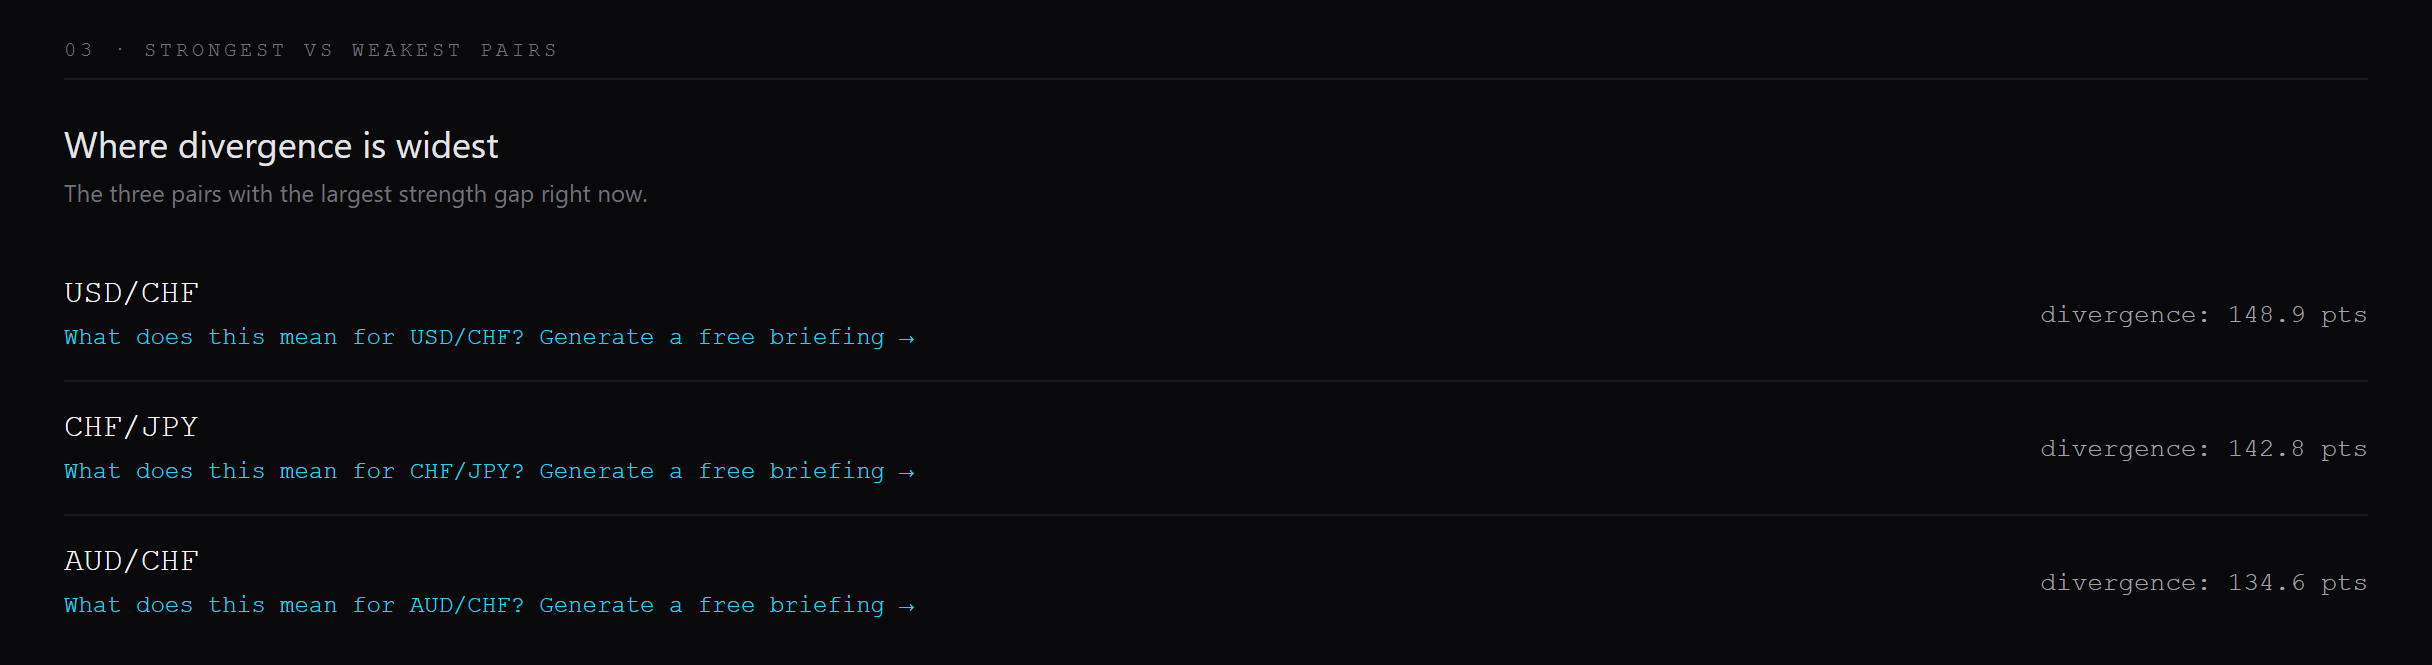
RiskFloor's free tools bring in most of its visitors, with no ad budget: in the 30 days to October 30, 234 of the site's 253 visitors used a tool. The currency strength meter, which ranks the eight major currencies from strongest to weakest, is the one people come back to.
Between June 23 and October 30, 472 browsers visited the tools. 34 came back on three or more days, and 33 of those used the strength meter. Ten of those 34 regulars signed up. Twenty-four never did. Nineteen of the 24 saw the link to a free briefing, and 4 clicked it.
The constraint
I chose not to put the tools behind a sign-up. Search and ChatGPT traffic lands on them, and a wall would put that at risk.
The problem
People come back to the free strength meter as a routine, but nothing in it needs an account, so the regulars who value it most never create one.
How might we give a regular a reason to create an account that's about the tool they already use, not about a product they didn't come for?
The principle I set: the free tool stays free. The account has to add continuity or notice, not access.
What other strength meters charge for
I checked four currency strength tools on November 3, from their own pages and app store listings, not hands-on use. Two questions: is the basic ranking free, and what does paying or signing up add?
Two of the four give the ranking away free. The two that charge for the ranking lead with alerts and a history look-back as the reason to pay. That fits keeping RiskFloor's ranking free, and it points at alerts as the likeliest thing worth an account. The broker's free meter is a door to a trading account; RiskFloor doesn't sell trading, so its account has to earn its place on the tool's own terms. A listing shows what a competitor bets people will pay for, not what traders actually use.
Proto-personas
These are proto-personas: built from RiskFloor's usage data and my own trading since 2008, not from interviews. Each card separates what the data shows from what I assume, and the research plan exists to test the assumptions. They carry no quotes, because nobody has said anything yet.
The regular: checks, leaves, comes back
Primary proto-persona, and the subject of this case study.
| Who | A discretionary forex trader who checks the currency strength meter on several days |
|---|
| How they arrive | From a ChatGPT answer or a search result that points to the tool. ChatGPT was the largest single known source of tool visitors, 123 of 247 |
|---|
| What the data shows | Comes back on three or more days, on desktop (19 of 34 browsers) or phone (15). Of the 24 who never signed up, 15 are on desktop and 9 on phone. Uses the strength meter, rarely the other tools. Sees the briefing link, mostly doesn't click it. Hasn't signed up |
|---|
| What I assume they want | A fast answer to "which currency is strong or weak right now", in under a minute, on the pairs they trade, likely before deciding which pair to look at |
|---|
| What I assume gets in the way | An account offers nothing they don't already get for free. The briefing is a different product from the one they came for |
|---|
| What would prove me wrong | Regulars who say they'd never want an account for any reason, or who want the briefing and simply missed the link |
|---|
The pre-trade checker: signed up, tried a briefing, use is thin
Contrast proto-persona. The product was built for this person; this case study is about the first.
| Who | A signed-up trader who has opened at least one briefing |
|---|
| How they arrive | Mostly through the free tools first: of 28 accounts matched to analytics, 16 first landed on a tool page, and 11 came from ChatGPT |
|---|
| What the data shows | 43 accounts, 35 people after merging duplicates. Use is thin and uneven: 10 of 28 briefing users ran exactly one briefing, and one group of linked accounts ran 43 of the 102 real briefings |
|---|
| What I assume they want | The key levels and what would prove the setup wrong, quickly, before placing a trade |
|---|
| What I assume gets in the way | Not yet trusting an AI-written read. Not knowing when a new briefing is worth opening |
|---|
| What would prove me wrong | Checkers who say they came for the tools and never wanted a briefing at all |
|---|
If most sign-ups turn out to have come for the tools, the regular stays the primary persona and the briefing becomes a secondary path.
Current journey: the regular
The "Doing" and "Count" columns come from the data. "Thinking" is my assumption, and the research plan tests it.
What I'm testing
Every assumption on the persona cards, the method that tests it, and the result that would confirm or refute it.
Research plan
Four methods, because no single one reaches everyone. Signed-up users can be asked directly; anonymous regulars can only be observed or asked on the page.
1. Feedback study. One invite per person, not per account. Each person's path is picked from their usage before the first question loads, so nobody is asked what the data already shows: never ran a briefing (13 people), ran at least one but none in the last 14 days (17), or ran one in the last 14 days (5). The questions that test this case study offer a free-tools answer: "When you signed up, what were you hoping RiskFloor would do for you?", "What's the main reason you haven't run a briefing yet?" and "Which best describes what RiskFloor is for you?". The weak spot: the free-tools answer matters most to the people who never ran a briefing, and they're the least likely to reply. The reward is one month of Pro, on completion only, which biases replies toward people who want Pro. With 35 invitations, any count is directional, and the results will say exactly how many answered.
2. Usability sessions. In person, or unmoderated and recorded on their own device. Before the tasks: "How do you check currency strength today, and when?" Tasks 1 and 2 run on the live tool, task 3 on a clickable prototype:
- Find the strongest and weakest currency on the 4-hour view.
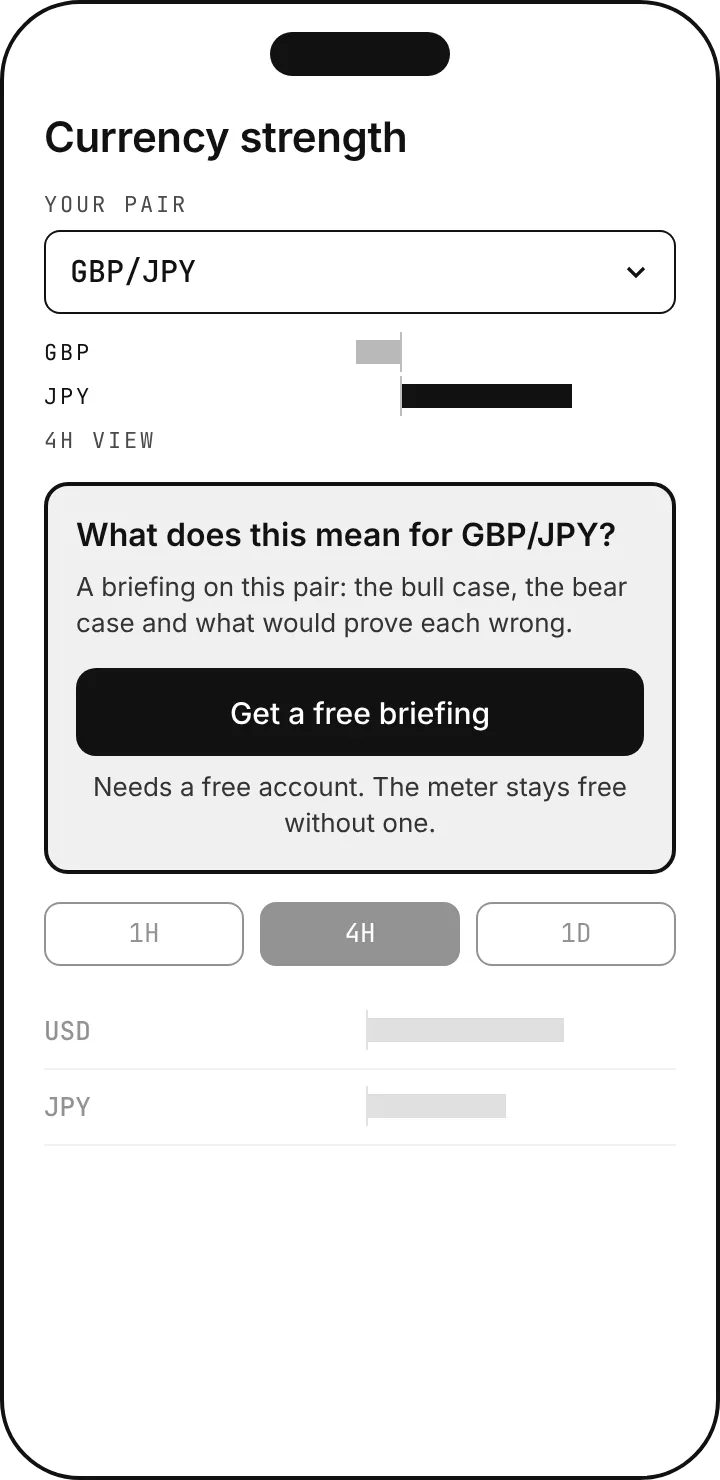
- Find the free briefing and say what you expect it to be before opening it.
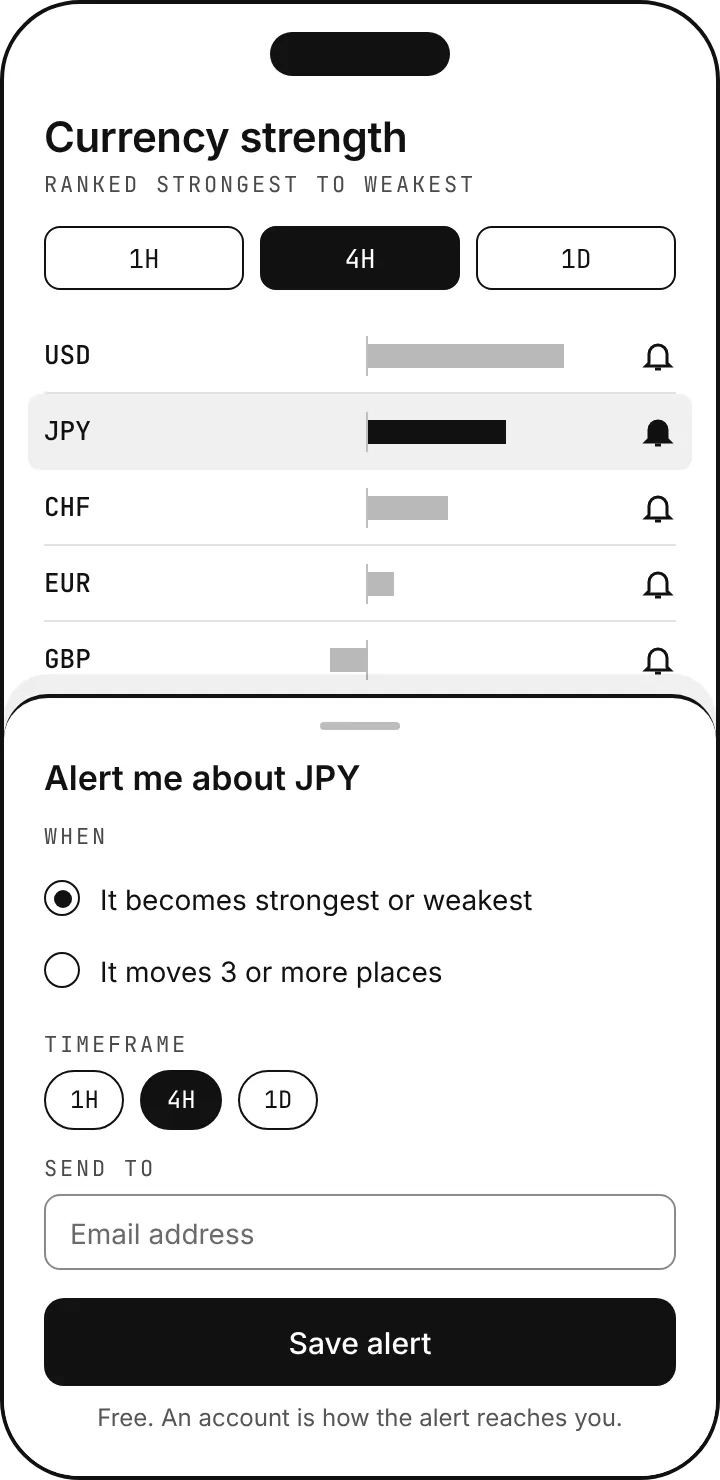
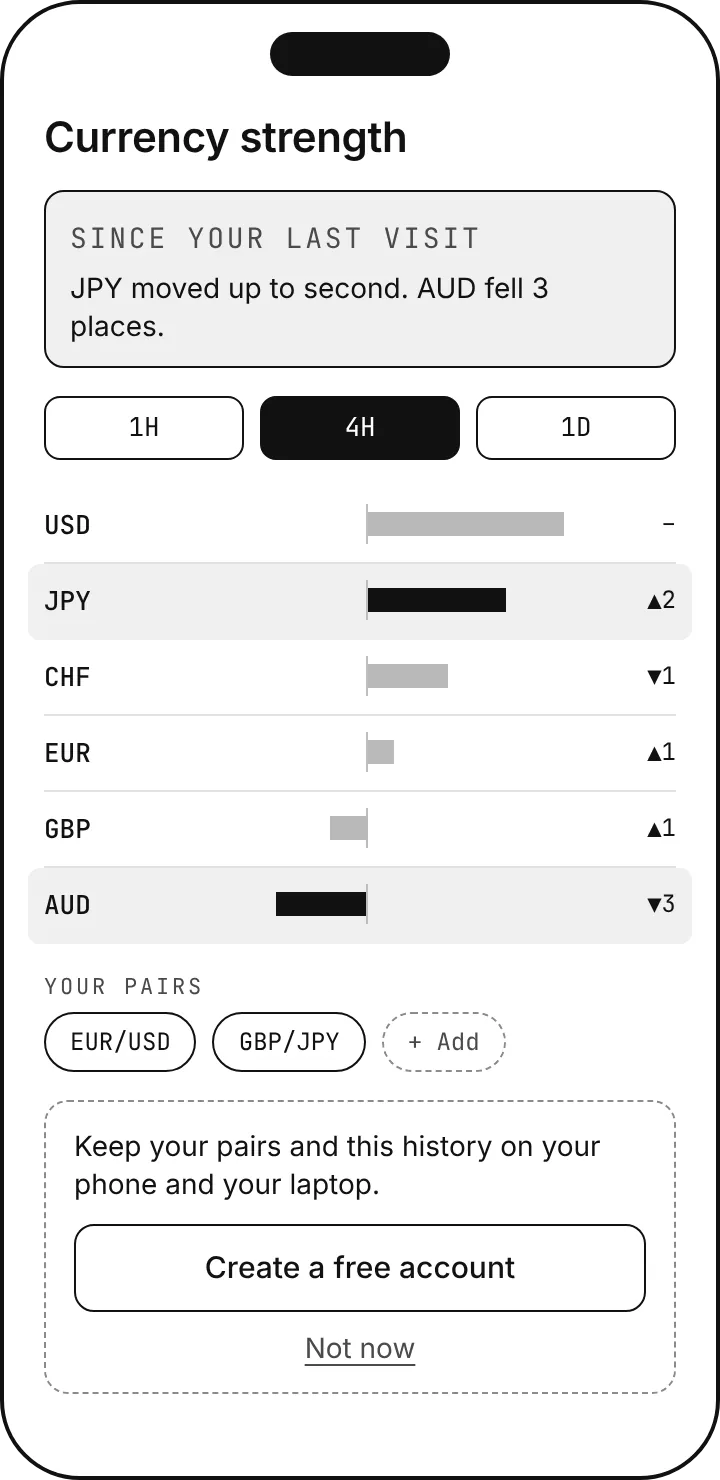
- See what changed since your last visit, then set an alert for a currency you follow.
After task 3: "Would you create an account for this? What else would it need?" Measures: task success, time on task against a benchmark of under a minute for tasks 1 and 2, errors, confidence after each task (1 to 5), and a short usability questionnaire. With five people these are signals, not statistics.
3. Intercept question. One question on the strength meter, shown only on a browser's third or later visit day: "What, if anything, would make an account worth creating for you?", open text, plus "Nothing, I just want the tool". It's the only method that reaches the 24 people this case study is about. The analytics tool can't target a visit count on its own, so the page counts visit days in the browser and triggers the question from the third.
4. Analytics. The same funnel, measured again once a direction ships, with the threshold for a real change set before the window opens. One confound to name: forex activity and visitor counts drop into the December holidays, so a window then compares unevenly with an October baseline.
If the feedback study and the intercept both show that regulars and sign-ups never wanted a briefing, the design work moves fully to the tool-first account.
Design directions to test
Each direction gives the account a job only an account can do, and leaves the free tool exactly as free as it is today. The ask comes after the person has done the thing, not before.
None of these is built. The usability sessions test directions 1 and 2 as a clickable prototype before any code is written. One constraint carries over from case study 1: an alert saying "USD is now strongest" could read as a trade signal, which the product deliberately avoids, so alert copy describes what changed and never suggests a trade. Before alerts go beyond the prototype, "flip" needs a fixed definition; one meter in the scan alerts when the strongest or weakest currency changes, which is where I'd start.
Results
Not yet. This section fills in when the feedback study closes, with how many people answered out of how many were invited, and again when the intercept and the sessions have run.
Honest limits
- The personas are assumptions. They come from usage data and my own trading, not interviews, and they're labelled that way.
- The counts are browsers, not people. One person on a phone and a laptop counts twice, and my own signed-out visits can't be separated out, so 34 is an upper bound.
- The numbers are small. At these counts, the method (the assumption table, the funnel, the intercept) is what I'd carry to a larger product, not the counts.
- The feedback study reaches the 10 regulars who signed up, not the 24 who didn't. Only the intercept reaches them, and it hasn't run.
How this was made
The counts come from RiskFloor's analytics export of October 30 and its account data, checked October 30 to 31. The feedback study comes from my form spec. Claude helped me pull the counts together and draft this page, and a second AI model audited the draft against the data; I corrected or cut what it couldn't support. The three sketches were drawn in code with Claude, from directions I set. The "what I assume" rows come from my own trading.